60 Best ER Diagram Examples
What is an ER Diagram?
Table of Contents
An entity relationship diagram, also known as an ERD, is a visual representation of data that’s organized into tables. It shows the different types of data in your database and how they relate to one another. An ERD makes it easier for you to find information when you’re creating a new database or designing software for your company. You can use an ERD to keep track of changes in your databases over time, which is helpful if you have multiple people working on them or if your company has multiple databases with overlapping information. An entity relationship diagram can be complex, but once you understand how it works, it’s not so difficult to create one yourself whenever necessary.
A form of flowchart called an Entity Relationship (ER) Diagram demonstrates how “entities” such as people, items, or concepts are related to one another. These “entities” might be anything from people to concepts to objects. They are also known as ERDs or ER Models, and they employ a predetermined set of symbols to illustrate the interconnection of things. Some examples of these symbols are rectangles, diamonds, ovals, and connecting lines.
What is the use and importance of ER Diagram?
An entity relationship diagram is a visual representation of the data in your database, as well as how it relates to other data. It’s also known as an ERD. An ERD is like a map for data, showing which tables are related to each other, what types of data each holds, and how data flows between tables. An ERD can be simple or complex, depending on the needs of your database. An ERD makes it easier for you to find information in your database. This is helpful if you’re creating a new database or designing software for your company. You can use an ERD to keep track of changes in your databases over time, which is helpful if you have multiple people working on them or if your company has multiple databases with overlapping information.
ER Diagram Symbols
In ER diagrams, a variety of symbols are employed to represent the various diagram elements.
The following are the symbols used in creating an ER Diagram:
- An entity is represented by a rectangle shape – it may refer to anything, person, or idea that may be recorded in a database, and rectangle symbol denotes them.
- Oval shape is the symbol stands for an attribute, which is a piece of data pertaining to an entity.
- Relationship: This icon depicts a connection between two things. There are two types of relationships: one-to-one and one-to-many.
How to Create an Entity Relationship Diagram?
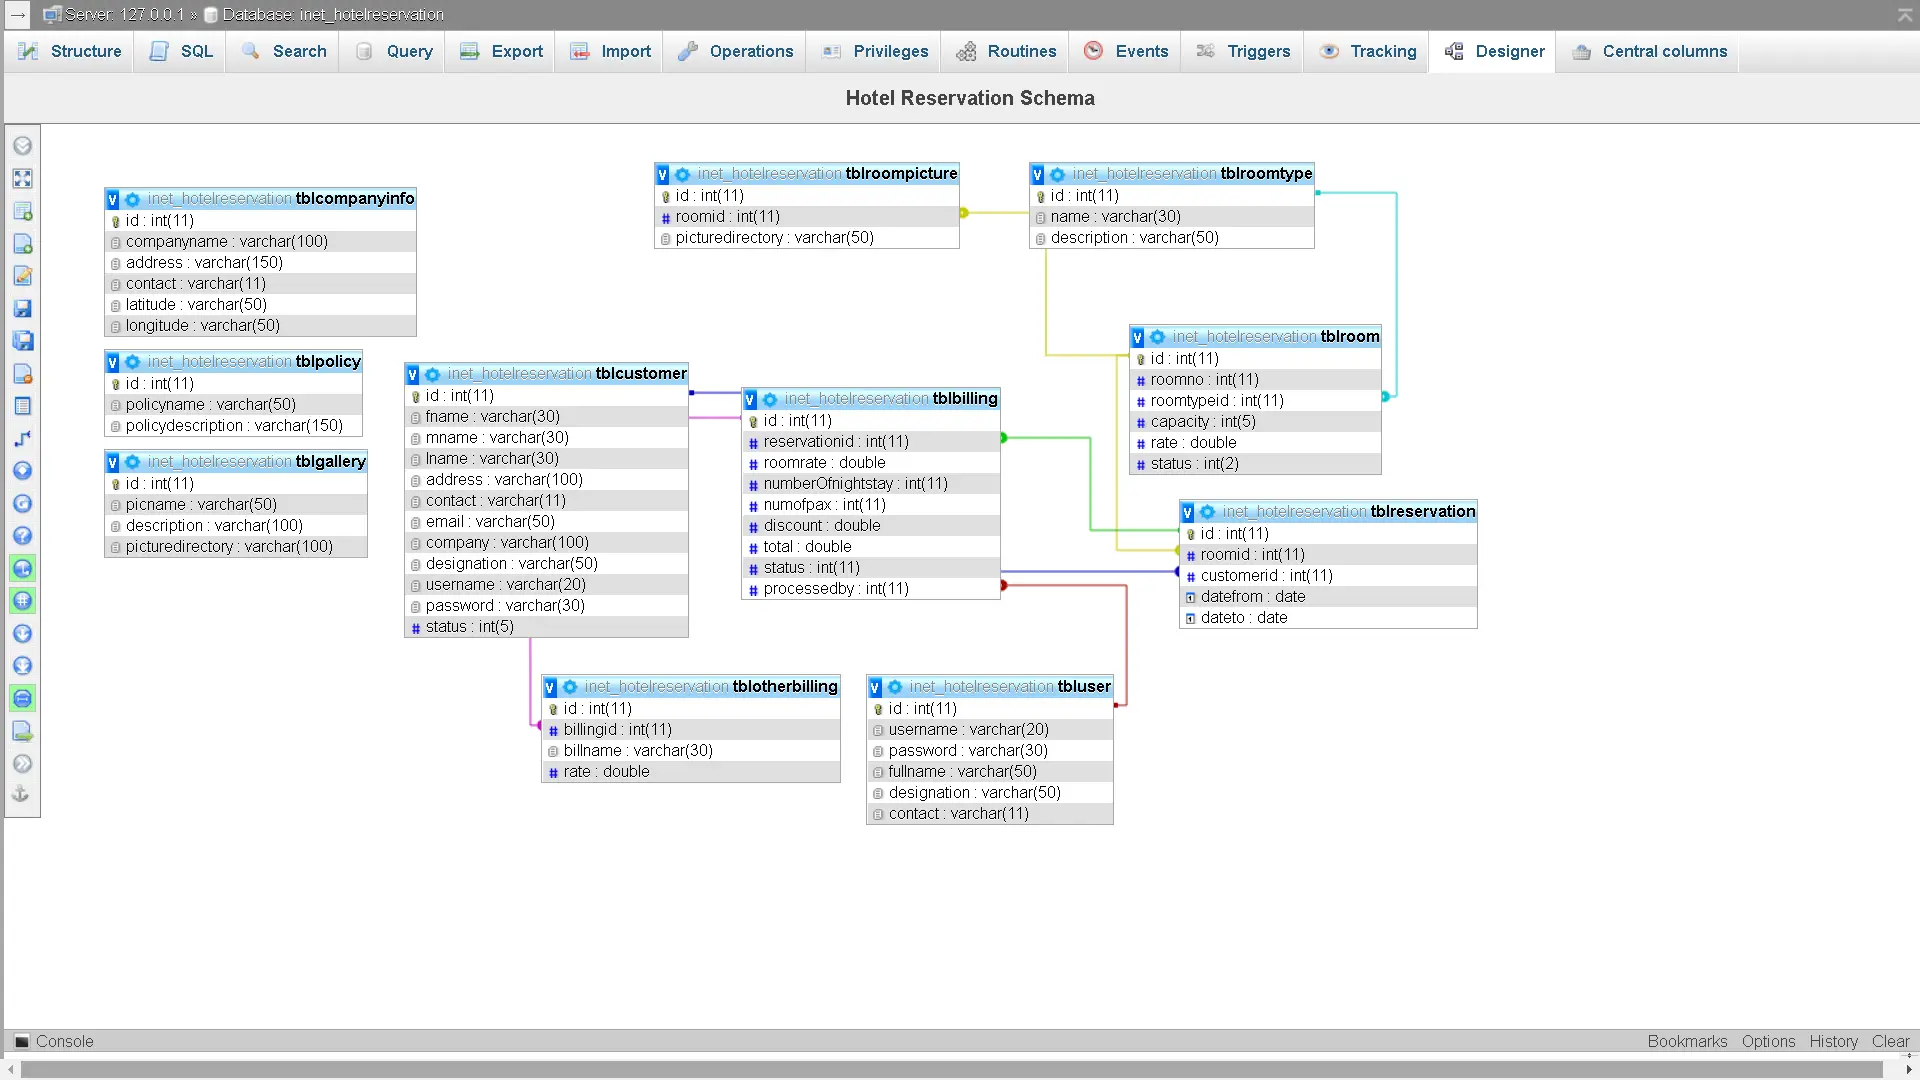
An entity relationship diagram is a visual representation of the data in your database, as well as how it relates to other data. It’s also known as an ERD. An ERD is like a map for data, showing which tables are related to each other, what types of data each holds, and how data flows between tables. An ERD can be simple or complex, depending on the needs of your database. Start by making a list of entities. For example, in a database of customers, the entities might be people’s names, addresses, and phone numbers. In a database of orders, the entities might be products, quantities, and prices. The entities are represented by boxes on an ERD. Next, create a list of relationships. These are how the data in your database is related to other data. A relationship could be one table linking to another or two tables linking together. For example, in a database of customers, one table might contain names, addresses, and phone numbers, while another table might contain products purchased. In a database of orders, one table might contain products and quantities, while the other table might contain prices. The relationships are represented by lines connecting the boxes on an ERD.
Tips for Drawing Your ERD
An entity relationship diagram is a visual representation of the data in your database, as well as how it relates to other data. It’s also known as an ERD. An ERD is like a map for data, showing which tables are related to each other, what types of data each holds, and how data flows between tables. An ERD can be simple or complex, depending on the needs of your database. – Start with a clean, fresh piece of paper or whiteboard. Getting everything out of your head and onto paper or a whiteboard can make the whole process easier. – Don’t get overwhelmed by the process. Take your time, and don’t feel like you have to get it right the first time. You can always go back and make changes later on. – Use flowcharts to map out the relationships between your data. Flowcharts can help you organize your thoughts and find any gaps in your data. – If you’re having trouble getting started, try thinking of your data in terms of people. What would you need to know about a person to store their information in your database? – If you’re working on a team, have everyone create their own ERDs. This can help avoid confusion over who is responsible for what.
ER Diagram Tools
There are a number of software programs available that can be used to create ER diagrams. Some of the most popular include Microsoft Visio, Lucidchart, and SmartDraw.
Microsoft Visio is a popular diagramming tool that can be used to create a variety of diagrams, including ER diagrams. It includes a wide range of shapes and drawing tools, as well as the ability to create and edit diagrams in a variety of formats.
Lucidchart is also a popular diagramming tool that can be used to create ER diagrams. It includes a wide range of features, including support for colors and fonts, as well as the ability to export diagrams into various formats.
SmartDraw is a program that can be used to create ER diagrams. It includes a range of features, but it is easy to use and can be exported into a variety of formats.
Projects with ER Diagram Example
The first project with ER Diagram example is the sales and inventory system – it is a software application that is used to track sales and inventory data. A database is often part of the system, which contains data about the products, sales, and invoice. The system might also come with a user interface that lets users input data, edit it, and create reports.
Next project with ER Diagram example is the Task management system. ER diagram is a graphical representation of the relationship between the various entities involved in a task management system. The entities include task, task category, project manager, and client info. The diagram shows how these entities are related to each other. It also shows the attributes of each entity and the relationships between them.
Number three on the list of project with ER Diagram example is the Employee Performance Evaluation System. A system for assessing the performance of employees Organizations utilizes ER diagrams as a tool to evaluate employee performance. The graphic offers a visual depiction of employee performance data that may be used to spot potential problem areas and areas that could use improvement. The graphic can also be used to spot patterns, monitor advancement, and assess employee performance over time. In the end, the ER diagram can aid in enhancing staff efficiency in the workplace.
The ER diagram for the real estate property management system is a graphical representation of the system that demonstrates the relationships between the different system entities. The ER diagram is a useful tool for system designers and developers to comprehend the links between the various system elements and to spot potential development opportunities. For this project, we have established nine entities; admin, notification, appointment, comment, client, agent, property, property and type property image. This is the 4th project on our list with ER Diagram example.
We will now proceed to the next project with ER Diagram example. A computerized system that facilitates online bus ticket reservations is known as a bus booking system. No matter the distance, this system can be used to reserve tickets for any bus route. A bus reservation system’s primary goal is to speed up and simplify the booking process for passengers. Please check this article if you want to know how we have prepared and established the relationships among the entities for this project.
A customer can place an order for food from a nearby restaurant or food outlet using an internet website or application using an online food ordering system. If a restaurant doesn’t offer its own delivery service, you can still use this method to get food from them.
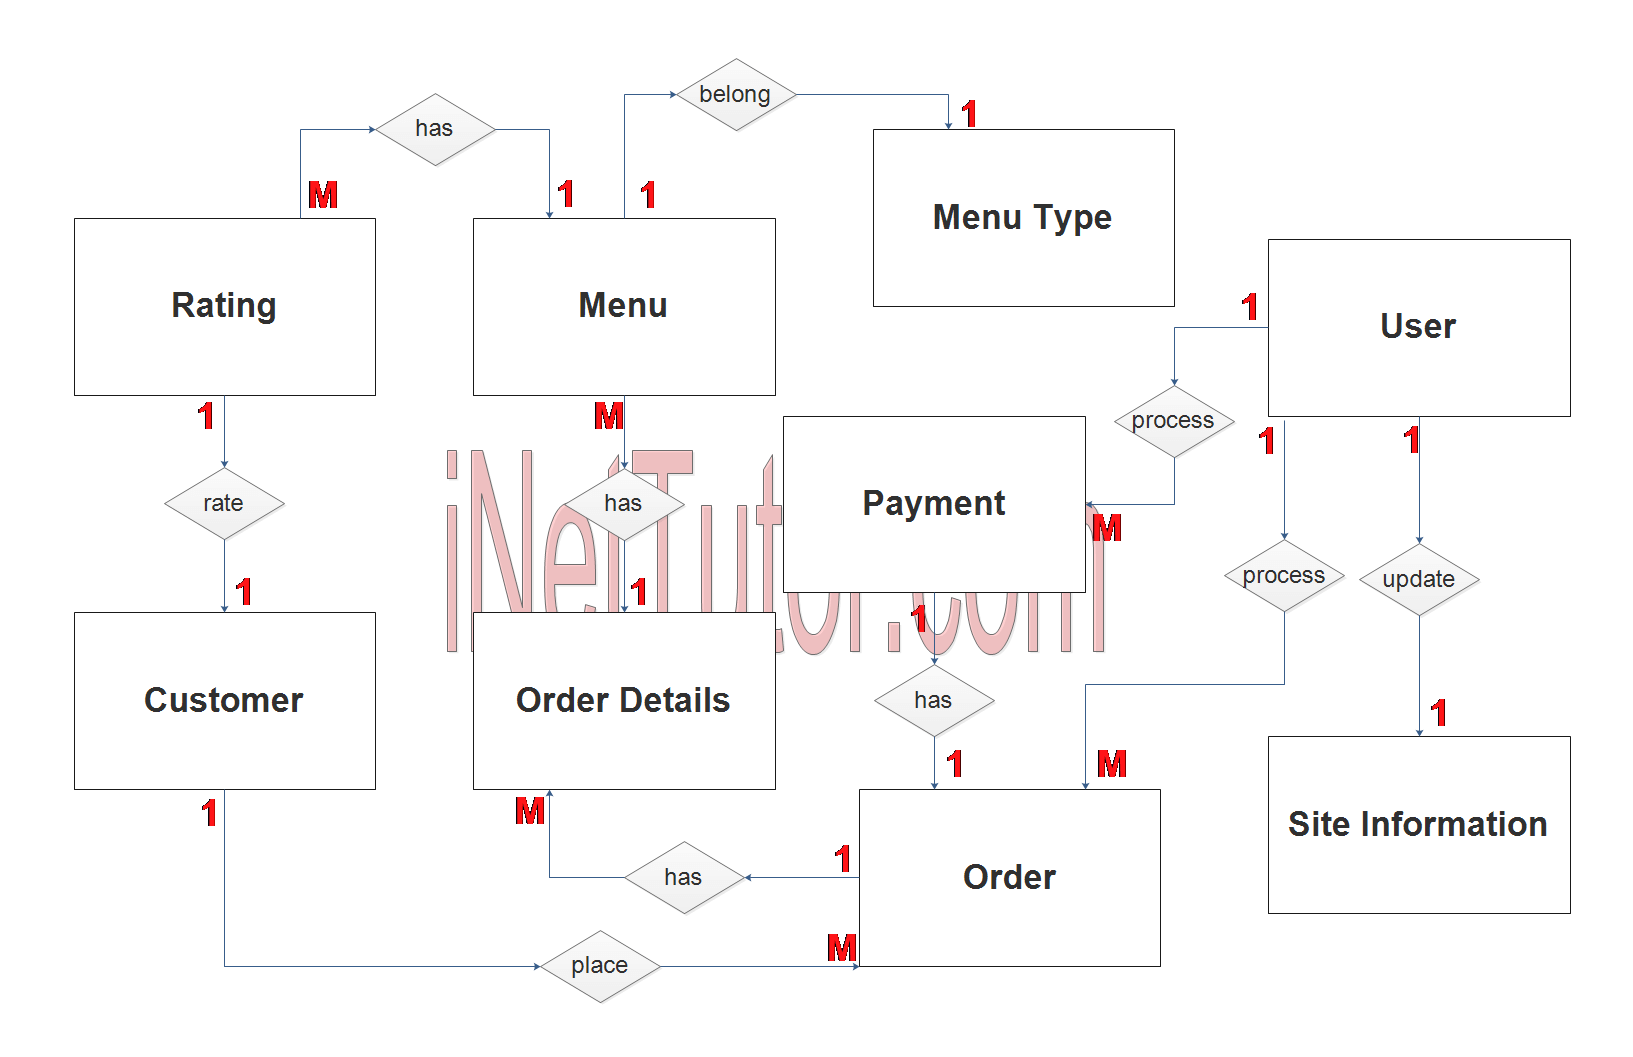
The entity relationship diagram, or ERD, preparation process for the project titled Online Food Ordering System will be covered in detail in this article. The purpose of this content is to provide and ER Diagram example for the topic on food ordering system.
A Gym Management System ER Diagram example is the next topic to be presented in this article. The project would typically include several entities, including membership information, work-out plan, and instructor information. The diagram would also show the relationships between these entities, such as which membership entitles a customer to access work-out plan or schedule of training to instructors. Lastly, the diagram is used to design the database and to understand how the data is related.
ER Diagram example for this topic is available and we have also provided a step by step guide on how to do it. In a retail setting, a POS system is a computerized system that is used to track and record sales transactions. A cash register, barcode reader, credit card reader, and receipt printer are often part of the POS system. ER Diagram It is a graphical representation of the data that is stored in the POS system. The diagram shows the entities, attributes, and relationships between the entities. Typically, the entities of the POS System are as follow; product, product category, product unit, sales, invoice, receive product, customer, supplier, purchase order and user. Visit the article for this to know more about on how to create and prepare and ER Diagram for POS System.
Organizations utilize a project management system as a tool to oversee and manage projects. The system can be used to manage the budget, allocate tasks to team members, and keep track of project status. Additionally, reports may be produced using the system, and stakeholders can receive and view project information. The article on Project Management System ER Diagram will discuss the step by step process on how to prepare the entity relationship diagram or ERD for the said project. ER Diagram example is the output for the said topic.
The entities in a car rental system ER diagram can be divided into two categories: the customer and the vehicle. The customer entity represents the person who is renting the vehicle, while the vehicle entity represents the car that is being rented. The relationship between these two entities is known as a one-to-one relationship, because each customer can only rent one vehicle at a moment. The purpose of a one-to-one relationship is to ensure that each customer has an equal chance of renting the vehicle they want. The team will not only provide the ER Diagram example for this project but the complete source code as well.
You may want to visit the: Car Rental Software
Here are the rest of the projects with ER Diagram example
- Medical Transcription System ER Diagram
- Vehicle Repair and Maintenance Management System ER Diagram
- Invoice Management System ER Diagram
- Digital Wallet Solution ER Diagram
- Tele Medicine Information System ER Diagram
- Remote Guidance System ER Diagram
- COVID-19 Facilities Information System ER Diagram
- Boarding House Management System ER Diagram
- Document Tracking System ER Diagram
- Waste Management with Reward System ER Diagram
- Vaccine Distribution System ER Diagram
- Job Portal System ER Diagram
- Shipping Management System ER Diagram
- Online School Documents Processing System ER Diagram
- Capstone Project Monitoring System ER Diagram
- OJT Records Monitoring System ER Diagram
- Multi Clinic Appointment System ER Diagram
- Faculty Evaluation System ER Diagram
- Driving School System ER Diagram
- Water Refilling System ER Diagram
- Dairy Farm Management System ER Diagram
- Procurement Management System ER Diagram
- Person with Disability (PWD) Information System ER Diagram
- Daily Time Record System ER Diagram
- Pet Shop Management System ER Diagram
- Curfew and Travel Pass System ER Diagram
- Vehicle Parking Management System ER Diagram
- Fire Safety Inspection Certificate System ER Diagram
- Medical Record and Billing System ER Diagram
- PE Tools Management System ER Diagram
- News Portal Application ER Diagram
- Voting System ER Diagram
- Visitor Log Monitoring System ER Diagram
- Barangay Management System ER Diagram
- Biometric Based Attendance System ER Diagram
- Health Center Patient Information System ER Diagram
- Web Based Grading System ER Diagram
- Canteen Sales and Credit Management System ER Diagram
- Billing Management System ER Diagram
- Business Permit System ER Diagram
- ELearning System ER Diagram
- Event Tabulation System ER Diagram
- Faculty Deliverables System ER Diagram
- Crime Reporting System ER Diagram
- Boarding House and Dormitory System ER Diagram
- Transcript of Records Processing System ER Diagram
- Customer Satisfaction System ER Diagram
- Attendance System ER Diagram
- Asset Management System ER Diagram
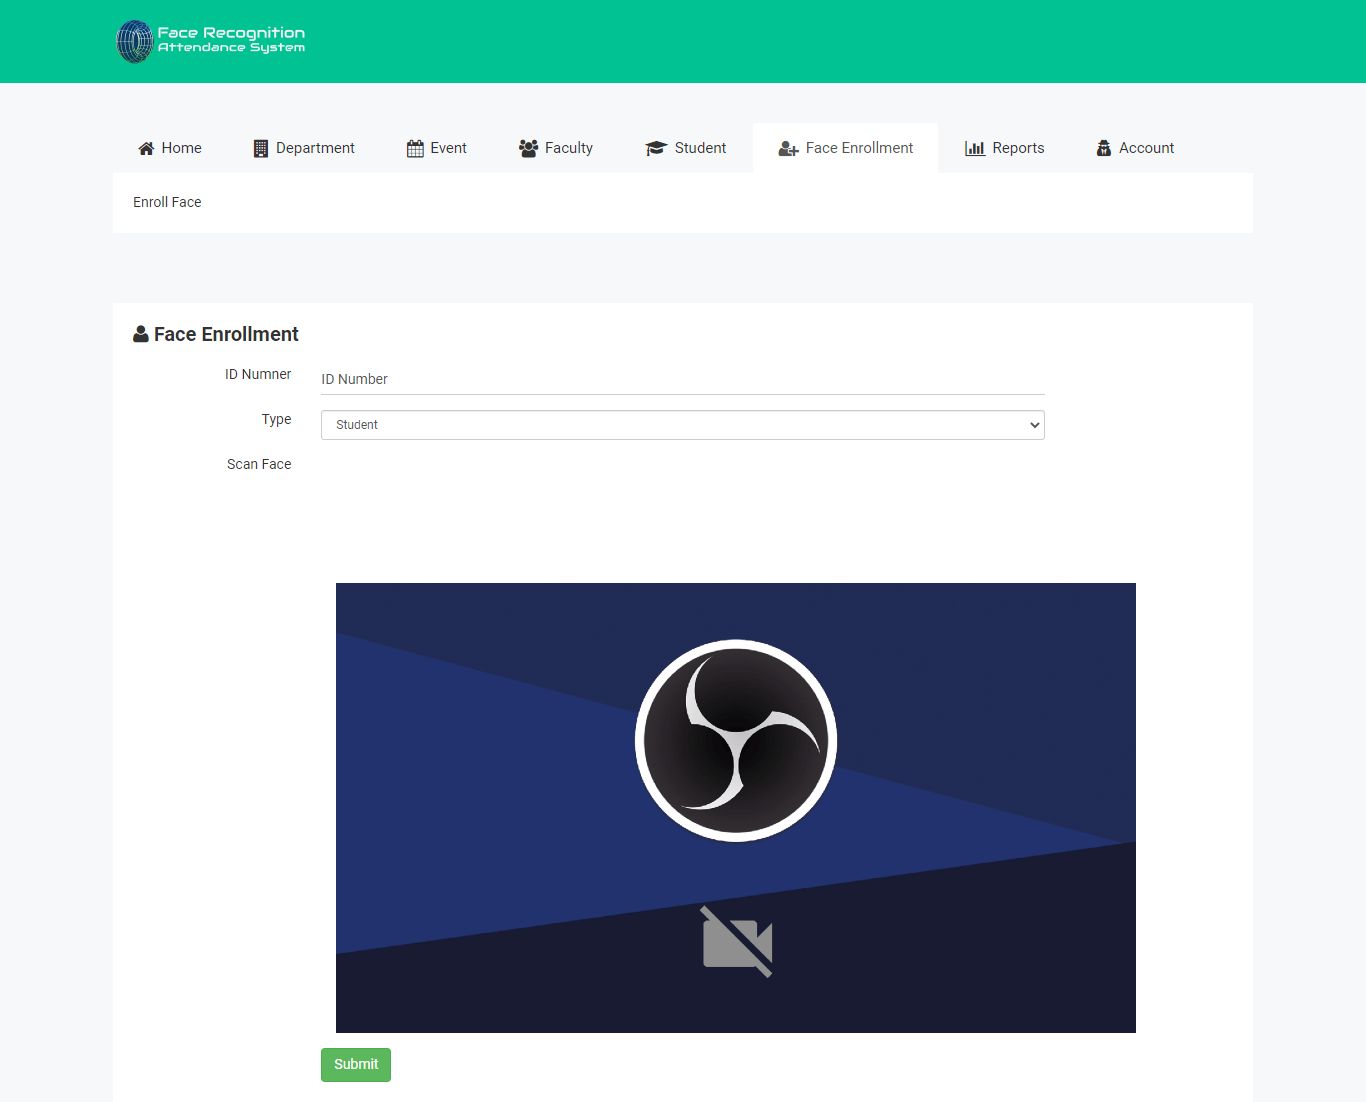
- Face Recognition Attendance System ER Diagram
Summary
An entity relationship diagram is a visual representation of the data in your database, as well as how it relates to other data. It’s also known as an ERD. An ERD is like a map for data, showing which tables are related to each other, what types of data each holds, and how data flows between tables. An ERD can be simple or complex, depending on the needs of your database. The process of creating an ERD doesn’t have to be intimidating. By starting with a clean slate, writing out your ideas, and mapping out the relationships between your data, you can create a helpful visual representation of your database. The next time you’re working with a database, whether it’s your company’s or one you’re using temporarily, an ERD can help you understand and navigate the data. The main target of this content or article is not just to provide a list of topics but also to give our readers the ER Diagram example for the above listed projects.
You may visit our Facebook page for more information, inquiries, and comments. Please subscribe also to our YouTube Channel to receive free capstone projects resources and computer programming tutorials.
Hire our team to do the project.
