Real Estate System Entity Relationship Diagram
Introduction
Table of Contents
The real estate industry relies heavily on accurate and organized data to manage listings, clients, transactions, and property details. With increasing digitization, real estate platforms and agencies need reliable systems to handle complex operations such as property management, buyer-seller interactions, lease agreements, and agent commissions. At the heart of these systems lies structured data, and managing it effectively requires a well-designed database.
An Entity Relationship Diagram (ER Diagram or ERD) is a visual representation of a system’s data structure. It outlines entities (such as Property or Client), their attributes (like Price or Contact Info), and the relationships between them (e.g., a Client buys a Property). ERDs play a crucial role in database design because they ensure all components of a system are clearly defined and logically connected before actual development begins.
This blog post aims to guide you through the process of creating an ER Diagram specifically for a real estate system. You’ll learn how to identify key entities, define attributes, and map out relationships relevant to the domain. We’ll also provide a working ER Diagram and a PlantUML script to help you visualize and implement your design.
Whether you’re a database designer, software developer, IT student, or a real estate tech entrepreneur, this guide will help you understand and model the core structure of a real estate system. Let’s dive into how ERDs can simplify and streamline real estate data management.
Overview of the Project
A real estate system involves several core components that work together to facilitate property transactions and management. These include properties, agents, clients (buyers and sellers), listings, appointments, and transactions. Properties may be listed for sale or rent, and each listing typically involves a real estate agent and a client. Clients can be either buyers or sellers, and they often interact with multiple listings before making or receiving an offer.
Managing this data manually can lead to inconsistencies, lost information, and inefficiencies. ER Diagrams help resolve these issues by structuring the data clearly. With an ERD, developers and stakeholders can visualize how different elements relate, making it easier to develop or scale the database.
For instance, consider a small real estate office that manages residential property listings. An agent adds property details to the system, including location, size, and price. A buyer searches the database for listings matching their criteria and schedules a viewing appointment. If interested, the buyer submits an offer, and the transaction is recorded once finalized.
This example highlights the need for accurate tracking of entities like Properties, Clients, Agents, and Transactions. An ER Diagram brings clarity to how these entities interact, enabling developers to build efficient systems tailored to real-world processes.
Key Concepts of ER Diagrams
An Entity Relationship Diagram (ERD) is foundational to designing any relational database. It visually represents entities, their attributes, and relationships, which helps developers understand the logical structure of the system before implementation.
Entities are the primary components and usually represent real-world objects or concepts—such as Property, Agent, or Client. Attributes define properties of these entities, like PropertyID, Location, and Price. Each entity must have a Primary Key (PK) to uniquely identify its records.
Relationships link entities together. For example, an Agent “lists” Properties, and a Client “schedules” Appointments. These relationships can be one-to-one, one-to-many, or many-to-many. Foreign Keys (FK) are used to implement these relationships in a relational database.
Let’s apply these fundamentals to the real estate domain. The Property entity may include attributes like PropertyID (PK), Address, Type, and Price. An Agent entity might include AgentID (PK), Name, and ContactInfo. The Client entity includes ClientID (PK), Name, and Role (buyer/seller). A Transaction entity connects Clients and Properties, showing ownership changes.
Simple Example:
Entity: Property
- PropertyID (PK)
- Address
- Type
- Price

Entity: Agent
- AgentID (PK)
- Name
- ContactInfo

Relationship: Agent LISTS Property (One-to-Many)
By understanding these basics, you’re equipped to model more complex relationships within the real estate domain.
Designing the ER Diagram for a Real Estate System
Step 1: Identify Entities
Main entities in a real estate system:
- Property
- Agent
- Client
- Listing
- Appointment
- Transaction
- Payment
Step 2: Define Attributes
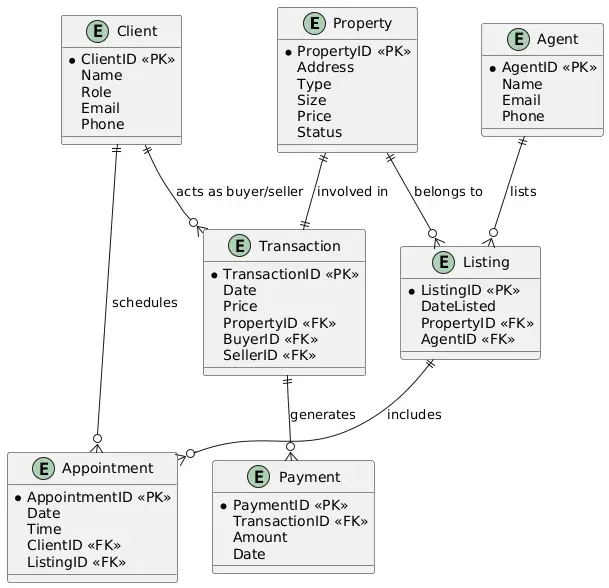
- Property: PropertyID (PK), Address, Type, Size, Price, Status
- Agent: AgentID (PK), Name, Email, Phone
- Client: ClientID (PK), Name, Role (Buyer/Seller), Email, Phone
- Listing: ListingID (PK), DateListed, PropertyID (FK), AgentID (FK)
- Appointment: AppointmentID (PK), Date, Time, ClientID (FK), ListingID (FK)
- Transaction: TransactionID (PK), Date, Price, PropertyID (FK), BuyerID (FK), SellerID (FK)
- Payment: PaymentID (PK), TransactionID (FK), Amount, Date
Step 3: Establish Relationships
- An Agent can list many Properties (one-to-many)
- A Property has one Agent (one-to-one or many-to-one)
- A Client can schedule many Appointments (one-to-many)
- A Listing can have many Appointments (one-to-many)
- A Transaction involves one Property and two Clients: a buyer and a seller
- A Transaction can have multiple Payments (one-to-many)
Step 4: Specify Constraints
- Primary keys ensure unique identification of records
- Foreign keys enforce referential integrity
- Cardinality rules define how many instances of one entity relate to another
Textual Structure Summary: Each Property is listed by one Agent but may be shown to many Clients via Appointments. A Client may act as either a Buyer or Seller in a Transaction involving a Property. Each Transaction may result in multiple Payments.
ER Diagram Example
Imagine a real estate database visualized with entities and their connections:
- Property is listed by an Agent
- Clients schedule Appointments to view Listings
- A Transaction captures the buying process between two Clients: the Buyer and Seller
- Each Transaction can include multiple Payments
This ER Diagram helps you see how data flows in the real estate system. For example, if a buyer views multiple properties and finally purchases one, the database tracks their activity from initial appointment to final payment. It also connects the listing agent and seller to the transaction, ensuring all parties are properly linked in the system.
Such structure makes it easier to manage commissions, generate reports, and keep historical records. Tools like Lucidchart or Draw.io can be used to draw this ER Diagram with clear entity boxes and relationship lines.
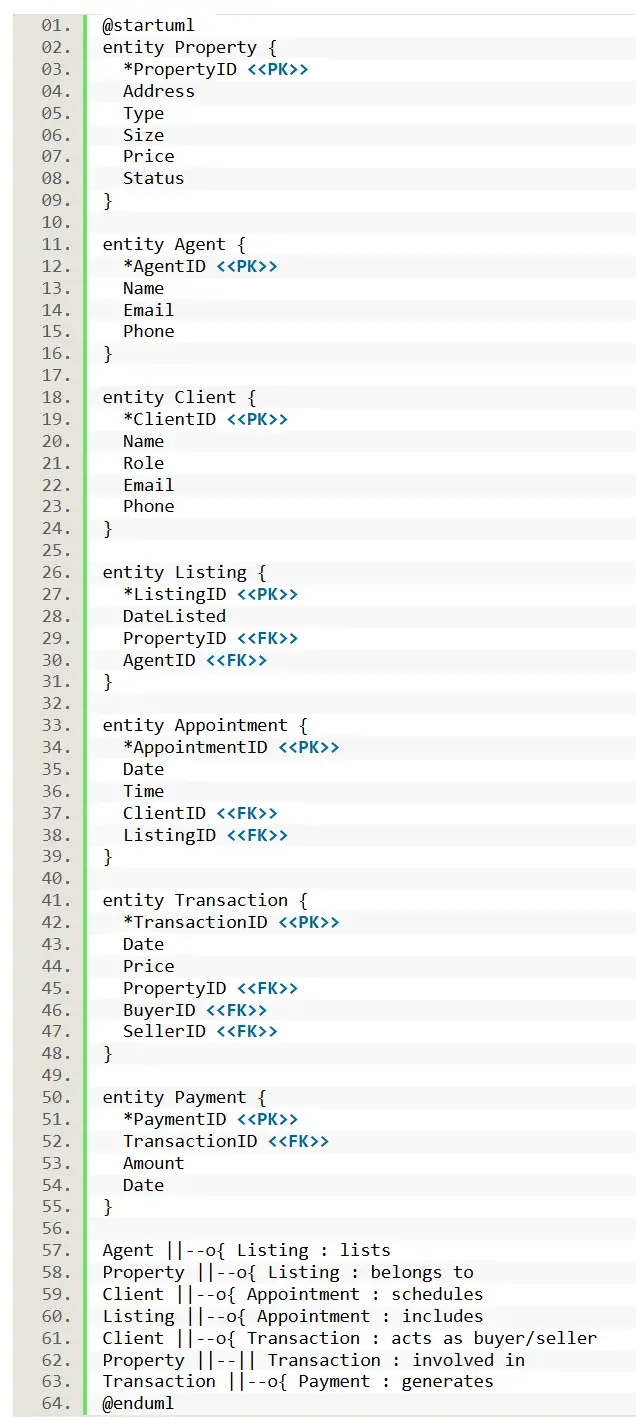
PlantUML Script
@startuml
entity Property {
*PropertyID <<PK>>
Address
Type
Size
Price
Status
}

entity Agent {
*AgentID <<PK>>
Name
Email
Phone
}

entity Client {
*ClientID <<PK>>
Name
Role
Email
Phone
}

entity Listing {
*ListingID <<PK>>
DateListed
PropertyID <<FK>>
AgentID <<FK>>
}

entity Appointment {
*AppointmentID <<PK>>
Date
Time
ClientID <<FK>>
ListingID <<FK>>
}

entity Transaction {
*TransactionID <<PK>>
Date
Price
PropertyID <<FK>>
BuyerID <<FK>>
SellerID <<FK>>
}

entity Payment {
*PaymentID <<PK>>
TransactionID <<FK>>
Amount
Date
}

Agent ||--o{ Listing : lists
Property ||--o{ Listing : belongs to
Client ||--o{ Appointment : schedules
Listing ||--o{ Appointment : includes
Client ||--o{ Transaction : acts as buyer/seller
Property ||--|| Transaction : involved in
Transaction ||--o{ Payment : generates
@enduml
Best Practices for Real Estate ER Diagrams
- Normalize your data to reduce redundancy. Separate entities like Property and Listing to maintain clean and scalable data.
- Use clear naming conventions for entities and attributes.
- Ensure relationship clarity by defining cardinality and direction.
- Don’t overcomplicate the model—only include relationships that are relevant to your system’s goals.
- Choose the right tools: Use Lucidchart, Draw.io, ERDPlus, or MySQL Workbench to create, refine, and share your ERDs.
- Plan for future growth: Consider scalability for handling more listings, agents, or advanced features like property valuation or chat logs.
Avoid circular relationships, ambiguous keys, and mixing multiple concepts in one entity. A well-structured ERD will save you time and headaches later during implementation and maintenance.
Real-World Applications
In practice, real estate ERDs support property listing platforms, customer relationship systems, and transaction tracking tools. Companies like Zillow, Realtor.com, and Redfin rely on robust database systems built from ERD models to power their applications.
For example, when a user searches for properties, the system queries relationships between listings, agents, and locations. When a transaction closes, the database logs buyer, seller, agent, and payment details. All of this is possible because the data is structured through a well-designed ER Diagram.
ERDs also assist in auditing, reporting, and compliance, ensuring transparency and data integrity across the system.
Conclusion
An Entity Relationship Diagram brings clarity to the structure of a real estate system. It defines how entities like properties, agents, and clients interact, ensuring efficient database development and management.
With the basics and practical steps outlined in this post, you now have the foundation to build or understand a real estate ERD. Start sketching your own diagram, or explore how other domains model their systems.
Have questions or suggestions? Drop a comment, check out the next post in this ERD series, or explore our recommended tools to build your own diagrams.
You may visit our Facebook page for more information, inquiries, and comments. Please subscribe also to our YouTube Channel to receive free capstone projects resources and computer programming tutorials.
Hire our team to do the project.