Payroll System Entity Relationship Diagram
Introduction
Table of Contents
Managing employee compensation is a vital aspect of any organization. A Payroll System handles the calculation, processing, and disbursement of salaries, taxes, and benefits for employees. Designing an efficient database for this system is essential for accuracy and compliance.
An Entity Relationship (ER) Diagram is a visual tool that outlines how data entities relate to each other in a system. It plays a crucial role in planning and structuring a database for payroll by identifying key components like employees, departments, and salary records.
This post aims to guide database designers, developers, and students in understanding and creating a Payroll System ER Diagram. You’ll learn about the domain, identify its entities and relationships, and get tips on creating a practical and scalable diagram.
Overview of the Payroll Domain
A Payroll System involves managing employee records, computing salaries based on working hours or fixed rates, applying tax deductions, and issuing payments. It often integrates with HR systems to streamline employee data management.
The core components include:
- Employee information (personal and job-related details)
- Salary structure (basic pay, allowances, deductions)
- Attendance or time logs
- Tax and benefit deductions
- Departments or job roles
Managing this data manually is time-consuming and error-prone. ER Diagrams help streamline the database design by visually organizing the entities and their connections, reducing redundancy, and improving data consistency.
For example, a small company with 50 employees needs a system that tracks each employee’s department, logs work hours, computes monthly salary, and issues payslips with tax deductions. An ER Diagram simplifies this process from the planning stage.
Key Concepts of ER Diagrams
Before diving into the Payroll ER Diagram, let’s recap the basics:
- Entity: A real-world object (e.g., Employee, Department).
- Attribute: Characteristics of an entity (e.g., Employee Name, Department ID).
- Relationship: How entities are connected (e.g., An Employee works in a Department).
- Primary Key: Uniquely identifies each record (e.g., EmployeeID).
- Foreign Key: Links one entity to another (e.g., DepartmentID in Employee table).
In the Payroll domain:
- An Employee has attributes like ID, Name, Position, and Salary.
- A Department has attributes such as ID and Name.
- A Payroll Record captures payment details and links to an employee.
These relationships build the structure that informs how payroll data is stored and accessed. Visualizing a basic relationship—such as Employee BELONGS_TO Department—lays the groundwork for more complex interactions.
Designing the ER Diagram for Payroll System
Step 1: Identify Entities
- Employee
- Department
- Payroll
- Attendance
- Tax
Step 2: Define Attributes
- Employee: EmployeeID (PK), FullName, Position, Email, DepartmentID (FK)
- Department: DepartmentID (PK), DepartmentName
- Attendance: AttendanceID (PK), EmployeeID (FK), Date, HoursWorked
- Payroll: PayrollID (PK), EmployeeID (FK), PayDate, BasicSalary, Deductions, NetSalary
- Tax: TaxID (PK), TaxType, Percentage
Step 3: Establish Relationships
- An Employee belongs to one Department
- An Employee has many Attendance records
- An Employee receives many Payroll records
- Payroll may include applicable Taxes
Step 4: Specify Constraints
- Primary Keys ensure each record is uniquely identified
- Foreign Keys connect related entities
- Cardinality:
- One Department → Many Employees
- One Employee → Many Payroll and Attendance records
- Many Payrolls → Many Taxes (many-to-many via a junction table, e.g., PayrollTax)
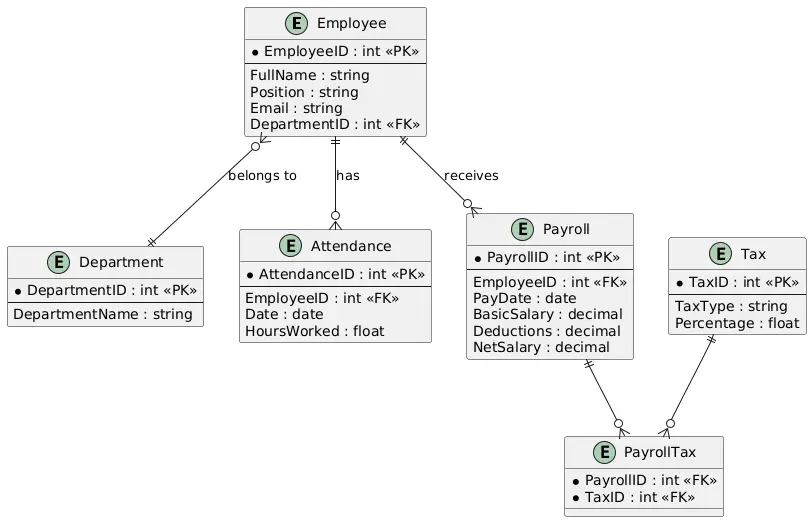
Textual Description of the ER Diagram:
The ER Diagram shows Employee connected to Department through a one-to-many relationship. Employee is also linked to Payroll and Attendance. Payroll is linked to Tax through a junction entity PayrollTax. Each table includes relevant fields to support calculations and reporting.
ER Diagram Example
Imagine a visual layout with five main entities:
- Employee connects to Department, Attendance, and Payroll
- Payroll connects to Tax through PayrollTax
For instance, John Doe (Employee) works in the Finance Department. His Attendance records show hours worked, which feed into the Payroll entity. Payroll calculations apply relevant Taxes, shown through the PayrollTax link.
This structure captures the payroll process end-to-end: tracking hours, computing pay, and applying deductions.
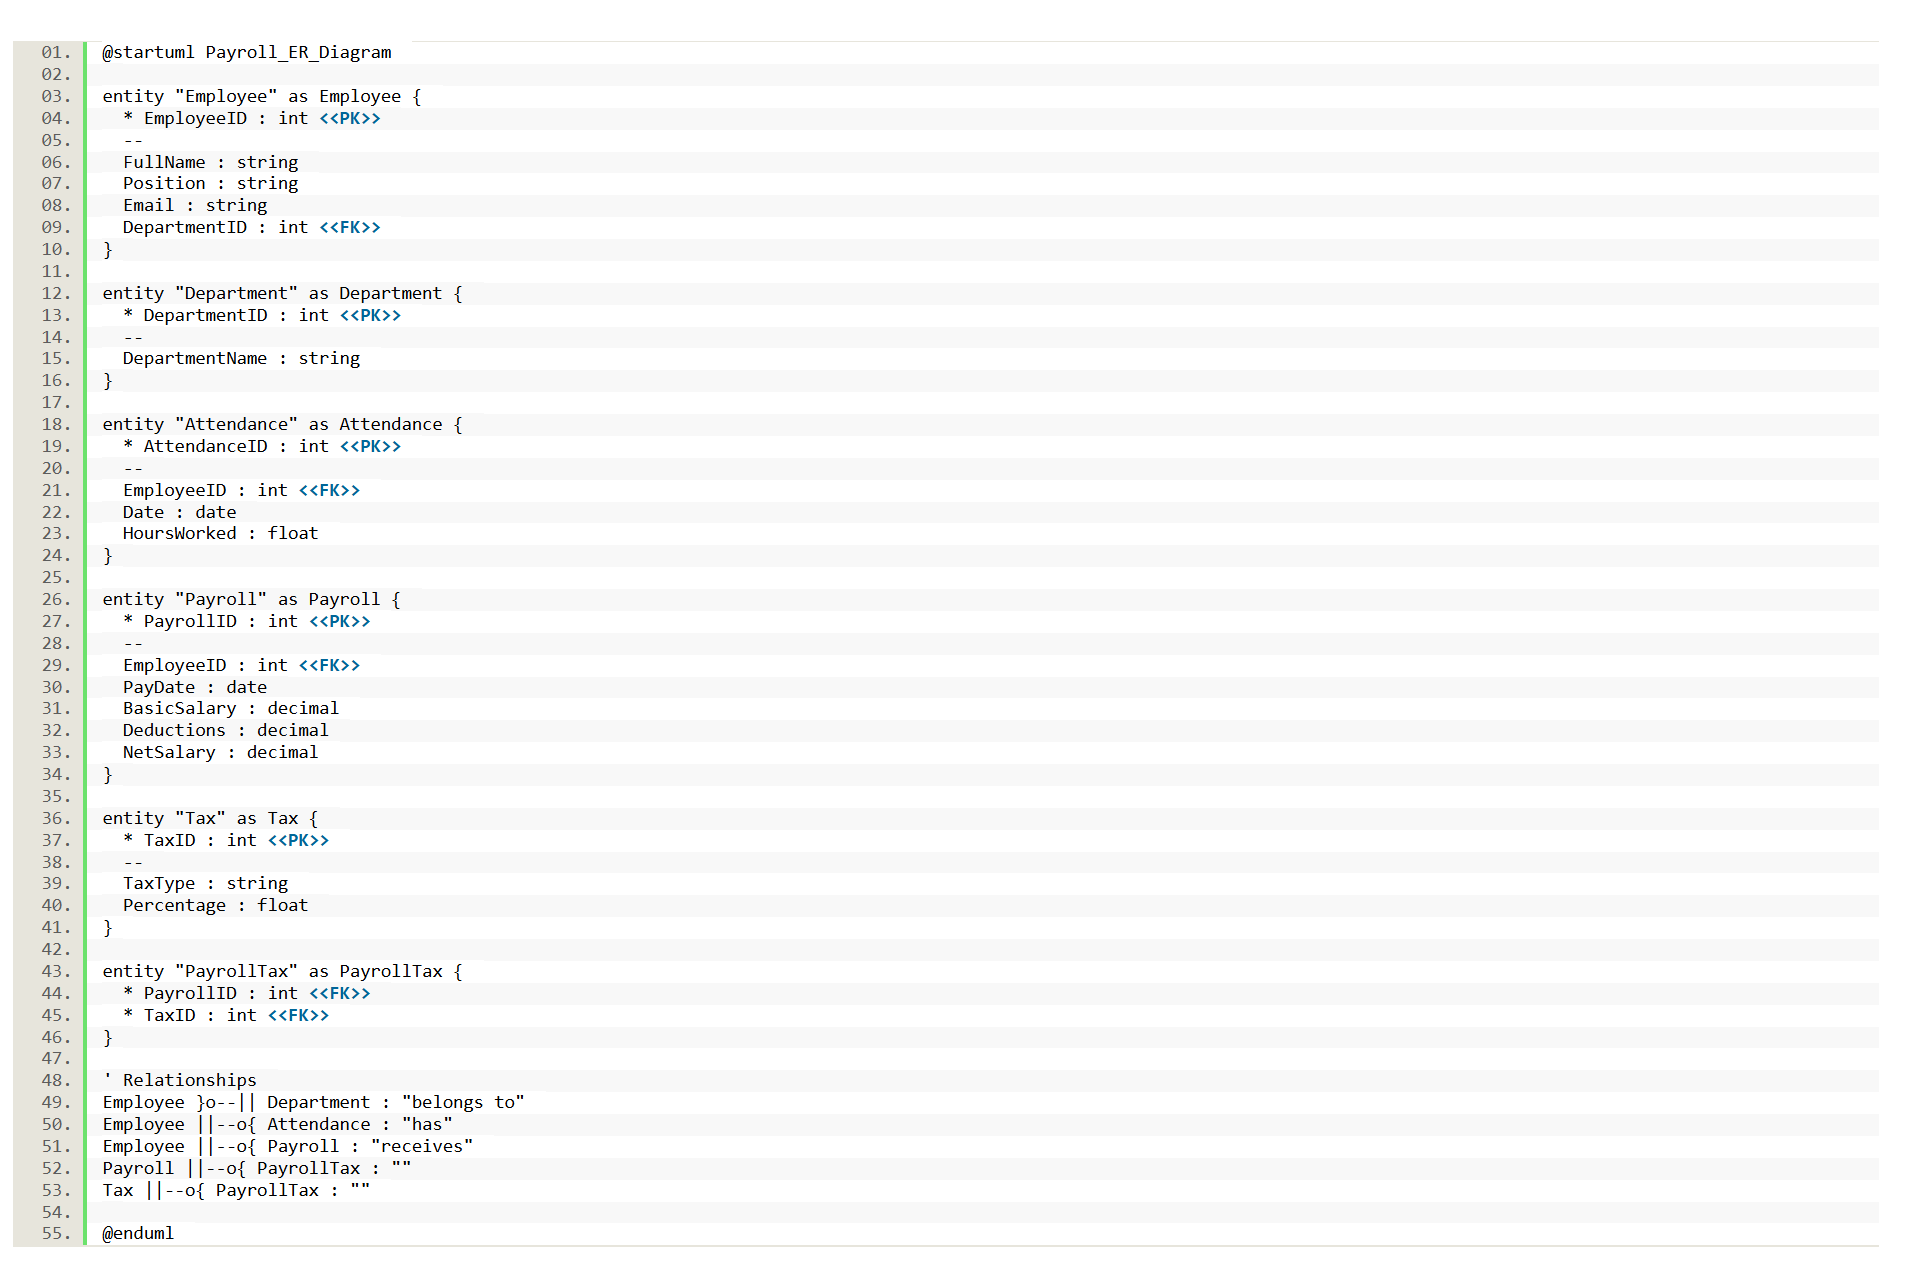
@startuml Payroll_ER_Diagram

entity "Employee" as Employee {
* EmployeeID : int <<PK>>
--
FullName : string
Position : string
Email : string
DepartmentID : int <<FK>>
}

entity "Department" as Department {
* DepartmentID : int <<PK>>
--
DepartmentName : string
}

entity "Attendance" as Attendance {
* AttendanceID : int <<PK>>
--
EmployeeID : int <<FK>>
Date : date
HoursWorked : float
}

entity "Payroll" as Payroll {
* PayrollID : int <<PK>>
--
EmployeeID : int <<FK>>
PayDate : date
BasicSalary : decimal
Deductions : decimal
NetSalary : decimal
}

entity "Tax" as Tax {
* TaxID : int <<PK>>
--
TaxType : string
Percentage : float
}

entity "PayrollTax" as PayrollTax {
* PayrollID : int <<FK>>
* TaxID : int <<FK>>
}

' Relationships
Employee }o--|| Department : "belongs to"
Employee ||--o{ Attendance : "has"
Employee ||--o{ Payroll : "receives"
Payroll ||--o{ PayrollTax : ""
Tax ||--o{ PayrollTax : ""

@enduml
Understanding the PlantUML Script
The PlantUML script above defines the structure and relationships for the Payroll System ER Diagram. Here’s a breakdown of how it works:
- @startuml and @enduml
These lines mark the beginning and end of the diagram. Everything between them will be processed by the PlantUML tool to render the ER Diagram.
- entity Blocks
Each entity block defines a table (or entity) in the diagram:
- Employee, Department, Attendance, Payroll, Tax, and PayrollTax are all treated as database entities.
- Inside each entity:
- Lines starting with * indicate Primary Keys.
- The <<PK>> and <<FK>> annotations label Primary Keys and Foreign Keys for clarity.
- The attributes listed after — are regular fields.
- Relationships
The lines connecting entities define how tables relate to each other:
- Employee }o–|| Department means many employees belong to one department (many-to-one).
- Employee ||–o{ Attendance shows one employee can have multiple attendance records.
- Payroll ||–o{ PayrollTax and Tax ||–o{ PayrollTax define a many-to-many relationship via the junction table PayrollTax.
These arrows use specific symbols:
- || = one
- o{ or }o = many
- Direction of the arrow shows dependency or association
- Rendering the Diagram
You can copy this script into any PlantUML online editor, or use local tools like PlantUML with VS Code or IntelliJ plugins to generate the diagram image.
This scripting approach gives you full control over layout, labeling, and styling—perfect for creating database models in a developer-friendly format.
Best Practices for Payroll ER Diagrams
- Normalize your tables to reduce redundancy (e.g., separate Taxes and connect via a junction table)
- Keep scalability in mind: allow easy addition of new tax types or departments
- Use meaningful attribute names (e.g., PayDate, NetSalary) for clarity
- Avoid overcomplicating relationships—keep it intuitive and clean
Recommended tools:
- Draw.io or Lucidchart for fast diagramming
- ERDPlus for teaching and student projects
- MySQL Workbench for integration with database design
Real-World Applications
A payroll ER Diagram translates directly into databases for HR software like ADP or Paychex, enabling accurate salary processing, tax reporting, and leave tracking. Industries such as retail, healthcare, and education rely on such diagrams to manage large employee datasets. For example, a hospital uses a payroll database to calculate shift differentials and overtime for nurses. The diagram ensures compliance with labor laws by structuring tax and deduction data. Tools like Oracle HCM or SAP SuccessFactors leverage similar ER models to streamline payroll operations. By organizing entities like Employee and Payroll, the diagram supports efficient querying and reporting, making it indispensable for businesses aiming to automate and scale their payroll processes.
Conclusion
This post explored how to design an ER Diagram for a payroll system, covering entities like Employee, Payroll, and Tax, and their relationships. By following a structured approach, you can create a scalable database to manage salaries, taxes, and leave records efficiently. ER Diagrams simplify complex payroll data, ensuring accuracy and compliance. Try designing your own payroll ER Diagram using tools like Draw.io, or explore related domains like e-commerce in our next post. Share your thoughts or questions in the comments—what entities would you add to a payroll system?
You may visit our Facebook page for more information, inquiries, and comments. Please subscribe also to our YouTube Channel to receive free capstone projects resources and computer programming tutorials.
Hire our team to do the project.