Inventory Management System Use Case Diagram
Introduction
Table of Contents
Ever felt stuck trying to explain how your IT project works to a teammate or client? You’re not alone. When you’re building systems like inventory or payroll, it’s easy to get overwhelmed by details. That’s where use case diagrams come in. They simplify everything.
Use case diagrams are a key part of system design. They visually map out how users (called actors) interact with a system. Think of them as a storyboard for your software – helping you and others understand what the system should do and who’s involved. Whether it’s an employee checking stock levels or a manager generating payroll reports, use case diagrams make these interactions crystal clear.
These diagrams aren’t just for senior developers. For IT students and junior devs, they’re a powerful way to grasp project scopes and define requirements early. They also support better communication between developers and stakeholders. Everyone sees the same picture.
In this blog, I’ll walk you through how to create effective use case diagrams, step by step. You’ll learn the basics of use case diagram components, explore clear examples (like an inventory and payroll system), and get best practices to avoid common mistakes.
By the end, you’ll be ready to use use case diagrams to plan, present, and perfect your own IT projects.
Understanding Use Case Diagrams for IT Projects
Let’s break it down: a use case diagram shows what a system does and who interacts with it. Simple, right? It’s not about the internal workings of a system – it’s about user goals and system responses.
Here are the key use case diagram components:
- Actors: Users or other systems that interact with your system. They’re shown as stick figures.
- Use Cases: The tasks or functions the system performs. These are drawn as ovals.
- System Boundary: A box that defines what’s inside the system and what’s outside.
A sample scenario: You’re designing an inventory system. The Warehouse Manager (actor) logs in to add inventory (use case). This use case lives inside the system boundary – it’s a function of your system.
UML Basics
Use case diagrams are a part of UML (Unified Modeling Language). It’s a standardized way to represent software designs. Here’s a quick visual guide:
- Stick figure = actor
- Oval = use case
- Rectangle = system boundary
- Arrow = interaction (e.g., who initiates what)
When and Why to Use Use Case Diagrams
- Early planning: They clarify what your system must do.
- Requirement analysis: Stakeholders understand the scope clearly.
- Communication: Diagrams bridge gaps between devs and non-tech people.
They’re perfect for visualizing user interactions in IT project development—especially for systems like payroll, inventory, or booking apps. If you’re just starting a project or explaining your idea to teammates or clients, start with a use case diagram.
Use Case Diagram: Inventory System Example
An inventory system helps businesses manage stock, track product movement, and monitor supply levels. A well-designed system prevents stockouts, overordering, and mismanagement.
Let’s explore how a use case diagram can visualize this system.
Actors:
- Warehouse Manager – oversees inventory operations
- Sales Staff – checks item availability before processing sales
- System Administrator – manages user access and maintenance
Use Cases:
- Add Inventory
- Update Stock Levels
- Check Stock
- Generate Inventory Report
- Remove Inventory
- View Transaction History
System Boundary:
Everything happens within the “Inventory System.” External systems like POS or supplier databases are outside the boundary.
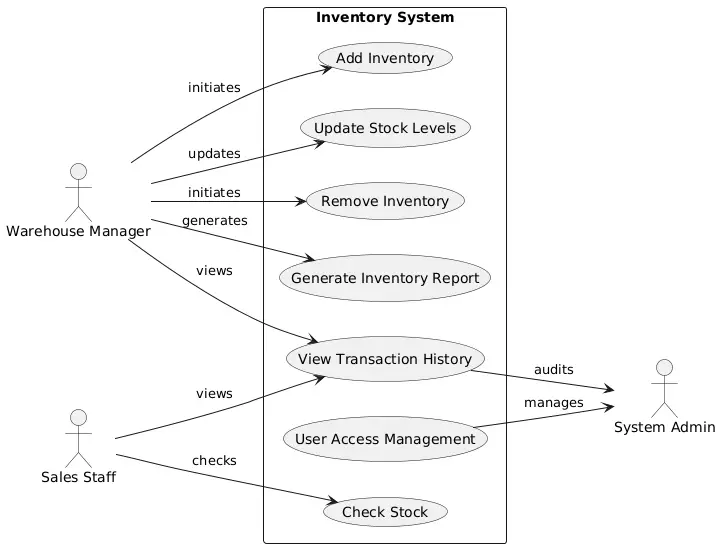
Imagine this setup:
- The Warehouse Manager initiates “Add Inventory,” “Remove Inventory,” and “Generate Inventory Report.”
- The Sales Staff uses “Check Stock” before finalizing sales.
- The System Administrator handles “User Access Management” and maintains the system.
Real-World Application:
This use case diagram helps project teams stay aligned. Instead of guessing what the system should do, they get a clear map. It also helps stakeholders (like business owners) understand what’s being built.
By clearly identifying interactions, this inventory system use case diagram improves efficiency and accountability. It’s a powerful tool for IT project visualization
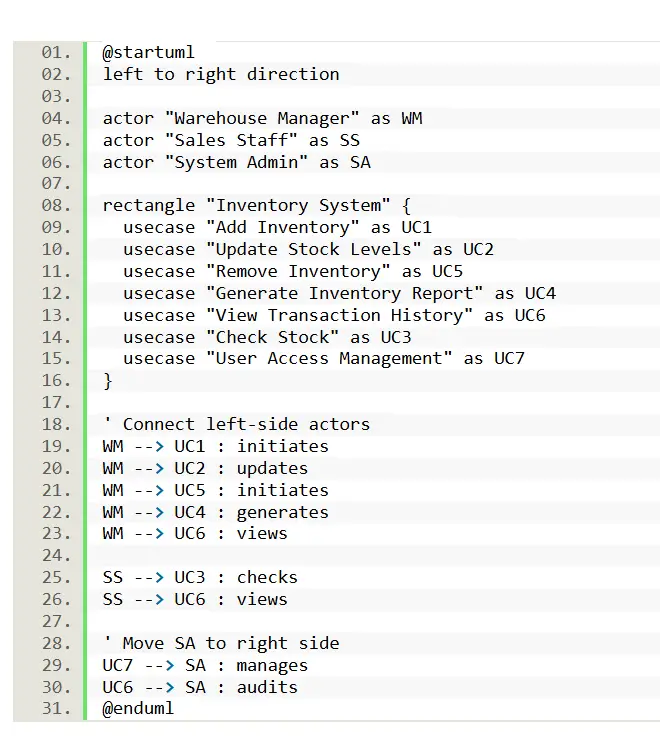
PlantUML Script for Inventory System Use Case Diagram
@startuml
left to right direction

actor "Warehouse Manager" as WM
actor "Sales Staff" as SS
actor "System Admin" as SA

rectangle "Inventory System" {
usecase "Add Inventory" as UC1
usecase "Update Stock Levels" as UC2
usecase "Remove Inventory" as UC5
usecase "Generate Inventory Report" as UC4
usecase "View Transaction History" as UC6
usecase "Check Stock" as UC3
usecase "User Access Management" as UC7
}

' Connect left-side actors
WM --> UC1 : initiates
WM --> UC2 : updates
WM --> UC5 : initiates
WM --> UC4 : generates
WM --> UC6 : views

SS --> UC3 : checks
SS --> UC6 : views

' Move SA to right side
UC7 --> SA : manages
UC6 --> SA : audits
@enduml
This PlantUML use case diagram script shows how actors like the Warehouse Manager and Sales Staff interact with the inventory system. Each actor is linked to specific actions, making the inventory system diagram easy to understand. You can use this script with PlantUML tools to quickly visualize and adjust your IT project structure.
Best Practices for Creating Use Case Diagrams
To make effective use case diagrams, you need to keep things simple and clear. Here are the use case diagram best practices I recommend:
Focus on Clarity
- Use short, descriptive names for each use case.
- Keep the diagram easy to scan. Don’t clutter it.
- Group related use cases visually to show structure.
Capture Key Interactions
- Identify all primary actors.
- Focus on user goals rather than system functions.
- Include only use cases that offer real value.
Validate Your Diagram
- Walk through the diagram with stakeholders.
- Confirm each actor-use case connection is accurate.
- Update the diagram as requirements evolve.
Avoid These Mistakes
- Too many use cases in one diagram. Break them up if needed.
- Skipping the system boundary. It helps define scope.
- Overlapping lines. Keep it clean and logical.
Tools That Help
You don’t need expensive software. Try these user-friendly diagram creation tools:
- Lucidchart – intuitive and great for collaboration
- Draw.io (diagrams.net) – free and simple to use
- PlantUML – text-based and integrates with dev tools
These tools make it easy to adjust your design and share it with your team. They support better IT project planning and speed up documentation.
Stick to these tips, and you’ll create use case diagrams that make sense – and make a difference.
Conclusion
Use case diagrams are more than just charts – they’re your project’s first visual language. They help you simplify complex systems, show user interactions clearly, and plan smarter.
Whether you’re building an inventory system, payroll app, or any IT solution, these diagrams help you clarify requirements early and avoid miscommunication. For IT students, they make abstract concepts concrete. For developers, they speed up development and review cycles.
In this blog, I walked you through the basics of use case diagrams, broke down components, and showed a practical use case example for an inventory system. You also got a ready-to-use PlantUML script and a set of best practices to build clear, professional diagrams.
I’d love to hear your thoughts! Drop a comment if you want diagrams for other systems like library management, POS, or e-commerce platforms. Or, if you’ve made your own diagrams, share them – let’s learn from each other.
Ready to try it yourself? Use tools like Draw.io, Lucidchart, or PlantUML to start building. Keep your users in focus, and your diagrams will guide your project to success.
Remember: great IT project planning starts with great visuals.
You may visit our Facebook page for more information, inquiries, and comments. Please subscribe also to our YouTube Channel to receive free capstone projects resources and computer programming tutorials.
Hire our team to do the project.