Ecommerce Entity Relationship Diagram
Introduction
Table of Contents
Ecommerce has transformed how businesses operate and interact with customers. From small retailers to large online marketplaces, managing data effectively is critical to delivering smooth transactions, tracking inventory, and improving customer experiences. A well-structured database lies at the core of any successful ecommerce system.
This is where Entity Relationship (ER) Diagrams come into play. An ER Diagram is a visual tool that helps in designing a database by mapping out entities (like customers and products), their attributes (like names or prices), and relationships (such as placing orders). It ensures clarity and consistency in data structure, making database development and maintenance more manageable.
In this post, I’ll guide you through understanding and designing an ER Diagram tailored for an ecommerce system. You’ll learn the basics, see how they apply specifically to ecommerce, and explore a complete example with a clear structure.
This guide is for database designers, web developers, students, and anyone aiming to build or understand ecommerce platforms. Whether you’re just learning or improving an existing system, this post will give you a strong foundation for creating efficient, scalable databases through ER Diagrams.
Overview of the Domain
Ecommerce systems revolve around buying and selling products online. The key components include customers, products, orders, payments, and inventory. When a customer browses a store, adds items to a cart, and places an order, all those steps involve data interaction that needs proper handling and structure.
Managing this data involves various challenges—tracking inventory levels, linking orders to customer details, handling multiple payment types, and updating product availability. These complexities can quickly overwhelm developers without a well-designed schema.
ER Diagrams help resolve this by offering a structured view of how the data is related. They prevent redundancy, ensure data integrity, and serve as a blueprint for database development.
Let’s consider a small online retail store. It sells electronics, clothing, and accessories. Customers can create accounts, place orders, and choose from multiple shipping and payment options. Each product has variants, like sizes or colors. Orders consist of multiple items and can have different statuses (e.g., pending, shipped, delivered).
This example shows how even a basic ecommerce setup involves many interconnected data points. With an ER Diagram, you can visualize and structure these relationships clearly before building the database. That’s why ERDs are essential for ecommerce development.
Key Concepts of ER Diagrams
To build an effective ER Diagram, you need to understand its fundamental components:
- Entities: These represent real-world objects. In ecommerce, typical entities include Customer, Product, and Order.
- Attributes: These describe properties of an entity. For example, a Product might have ProductID, Name, and Price.
- Relationships: These show how entities are connected. A Customer places an Order.
- Primary Keys (PK): Unique identifiers for each entity.
- Foreign Keys (FK): Attributes that link to primary keys in other tables to establish relationships.
In ecommerce:
- A Customer entity includes attributes like CustomerID, Name, Email.
- A Product includes ProductID, Name, Stock, Price.
- An Order links to both Customer and Product via relationships.
Here’s a basic example:
Customer (CustomerID, Name, Email)
|
| places
|
Order (OrderID, Date, CustomerID)
This shows that a customer can place orders, with each order linked back to a customer using CustomerID as a foreign key. ER Diagrams simplify database design by showing these relationships clearly and ensuring logical structure before implementation.
Designing the ER Diagram for Ecommerce
Step 1: Identify Entities
Main entities in an ecommerce system:
- Customer
- Product
- Order
- OrderItem (junction entity for many-to-many between Orders and Products)
- Payment
- Category
- Shipping
Step 2: Define Attributes
- Customer: CustomerID (PK), Name, Email, Phone, Address
- Product: ProductID (PK), Name, Description, Price, Stock, CategoryID (FK)
- Order: OrderID (PK), OrderDate, Status, CustomerID (FK)
- OrderItem: OrderItemID (PK), OrderID (FK), ProductID (FK), Quantity, Subtotal
- Payment: PaymentID (PK), PaymentDate, Amount, OrderID (FK), PaymentMethod
- Category: CategoryID (PK), CategoryName
- Shipping: ShippingID (PK), OrderID (FK), ShipDate, Carrier, TrackingNumber
Step 3: Establish Relationships
- A Customer places many Orders (one-to-many)
- An Order contains many OrderItems (one-to-many)
- A Product belongs to a Category (many-to-one)
- A Product appears in many OrderItems (many-to-many via OrderItem)
- An Order has one Payment
- An Order has one Shipping
Step 4: Specify Constraints
- Primary keys uniquely identify each record.
- Foreign keys establish entity relationships.
- Use one-to-many and many-to-many cardinalities appropriately.
ER Diagram Description
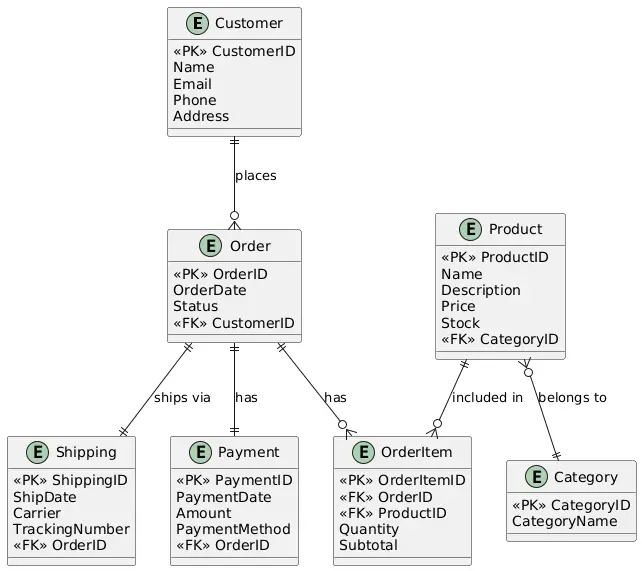
The ER Diagram starts with Customer connected to Order. Each Order links to multiple OrderItems, which connect back to Product. Product is categorized under Category. Order also links to Payment and Shipping. These relationships form a cohesive and scalable structure that supports real-world ecommerce operations.
ER Diagram Example
Here’s a walkthrough of the ecommerce ER Diagram:
- Customer includes contact information and serves as the source of each order.
- Each Order stores the transaction date, status, and links to a Customer.
- OrderItem serves as a junction between Order and Product, recording quantity and price.
- Product links to Category and includes data like name, price, and stock level.
- Payment logs the payment method and amount for each Order.
- Shipping tracks shipment data for the order.
This layout supports features like product filtering by category, order tracking, and customer histories. You can add more tables for promotions, reviews, or inventory logs as needed. This diagram is modular and can scale with the business.
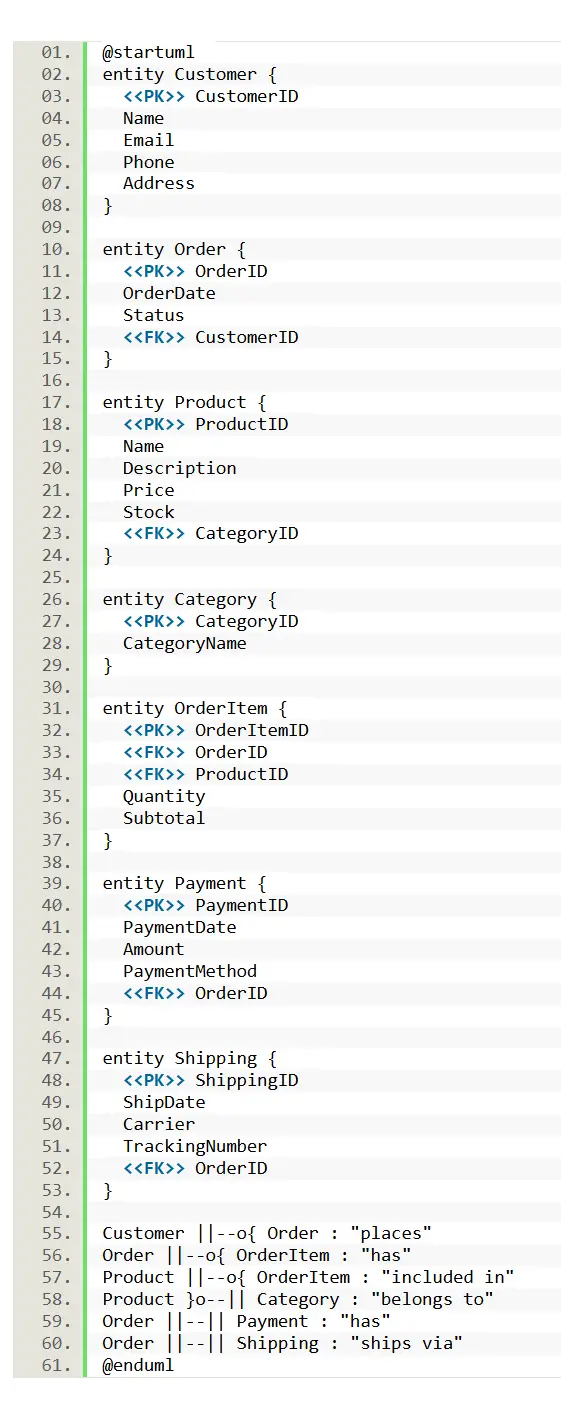
PlantUML Script
@startuml
entity Customer {
<<PK>> CustomerID
Name
Email
Phone
Address
}

entity Order {
<<PK>> OrderID
OrderDate
Status
<<FK>> CustomerID
}

entity Product {
<<PK>> ProductID
Name
Description
Price
Stock
<<FK>> CategoryID
}

entity Category {
<<PK>> CategoryID
CategoryName
}

entity OrderItem {
<<PK>> OrderItemID
<<FK>> OrderID
<<FK>> ProductID
Quantity
Subtotal
}

entity Payment {
<<PK>> PaymentID
PaymentDate
Amount
PaymentMethod
<<FK>> OrderID
}

entity Shipping {
<<PK>> ShippingID
ShipDate
Carrier
TrackingNumber
<<FK>> OrderID
}

Customer ||--o{ Order : "places"
Order ||--o{ OrderItem : "has"
Product ||--o{ OrderItem : "included in"
Product }o--|| Category : "belongs to"
Order ||--|| Payment : "has"
Order ||--|| Shipping : "ships via"
@enduml
Best Practices for Ecommerce ER Diagrams
To build an effective ecommerce ER Diagram:
- Normalize your data to reduce redundancy—store product info once, link it via foreign keys.
- Use clear naming conventions for entities and attributes to maintain readability.
- Include a junction table (like OrderItem) for many-to-many relationships.
- Plan for scalability—allow for future expansion like reviews, discounts, or returns.
Avoid:
- Overcomplicating relationships with unnecessary entities.
- Using generic field names like “Name” or “Info” without context.
- Skipping constraints, which can lead to data integrity issues.
Use tools like Lucidchart, Draw.io, ERDPlus, or MySQL Workbench to build and export diagrams easily. These tools support collaborative editing, exports, and templates—ideal for teams and students.
Real-World Applications
An ecommerce ER Diagram serves as the foundation for real-world systems. Platforms like Shopify, Magento, or WooCommerce use similar models to power online stores. Developers use these diagrams to implement databases that manage user data, product listings, order processing, and inventory control.
For instance, in a Shopify-like platform, the ER Diagram helps map how customers interact with products, make purchases, and receive deliveries. Retailers rely on this structure to track orders, manage stock, and generate sales reports.
Even small businesses use ERDs when setting up online stores with tools like Wix or BigCommerce. With a solid ER Diagram, they ensure that their backend supports growth and efficiency.
Conclusion
An ER Diagram helps simplify complex ecommerce systems by breaking them into manageable components. It gives you a visual framework for building a robust and scalable database.
In this post, you learned the basics of ER Diagrams, how they apply to ecommerce, and how to design your own. I walked you through a sample structure and provided a PlantUML script to help you generate the diagram instantly.
If you’re a developer, student, or instructor, try sketching out your own ecommerce ER Diagram. It’s a valuable exercise in database design and logic building.
I’d love to hear your thoughts—feel free to leave a comment or share your own version of the diagram. Stay tuned for the next post where we explore another real-world ERD example!
You may visit our Facebook page for more information, inquiries, and comments. Please subscribe also to our YouTube Channel to receive free capstone projects resources and computer programming tutorials.
Hire our team to do the project.